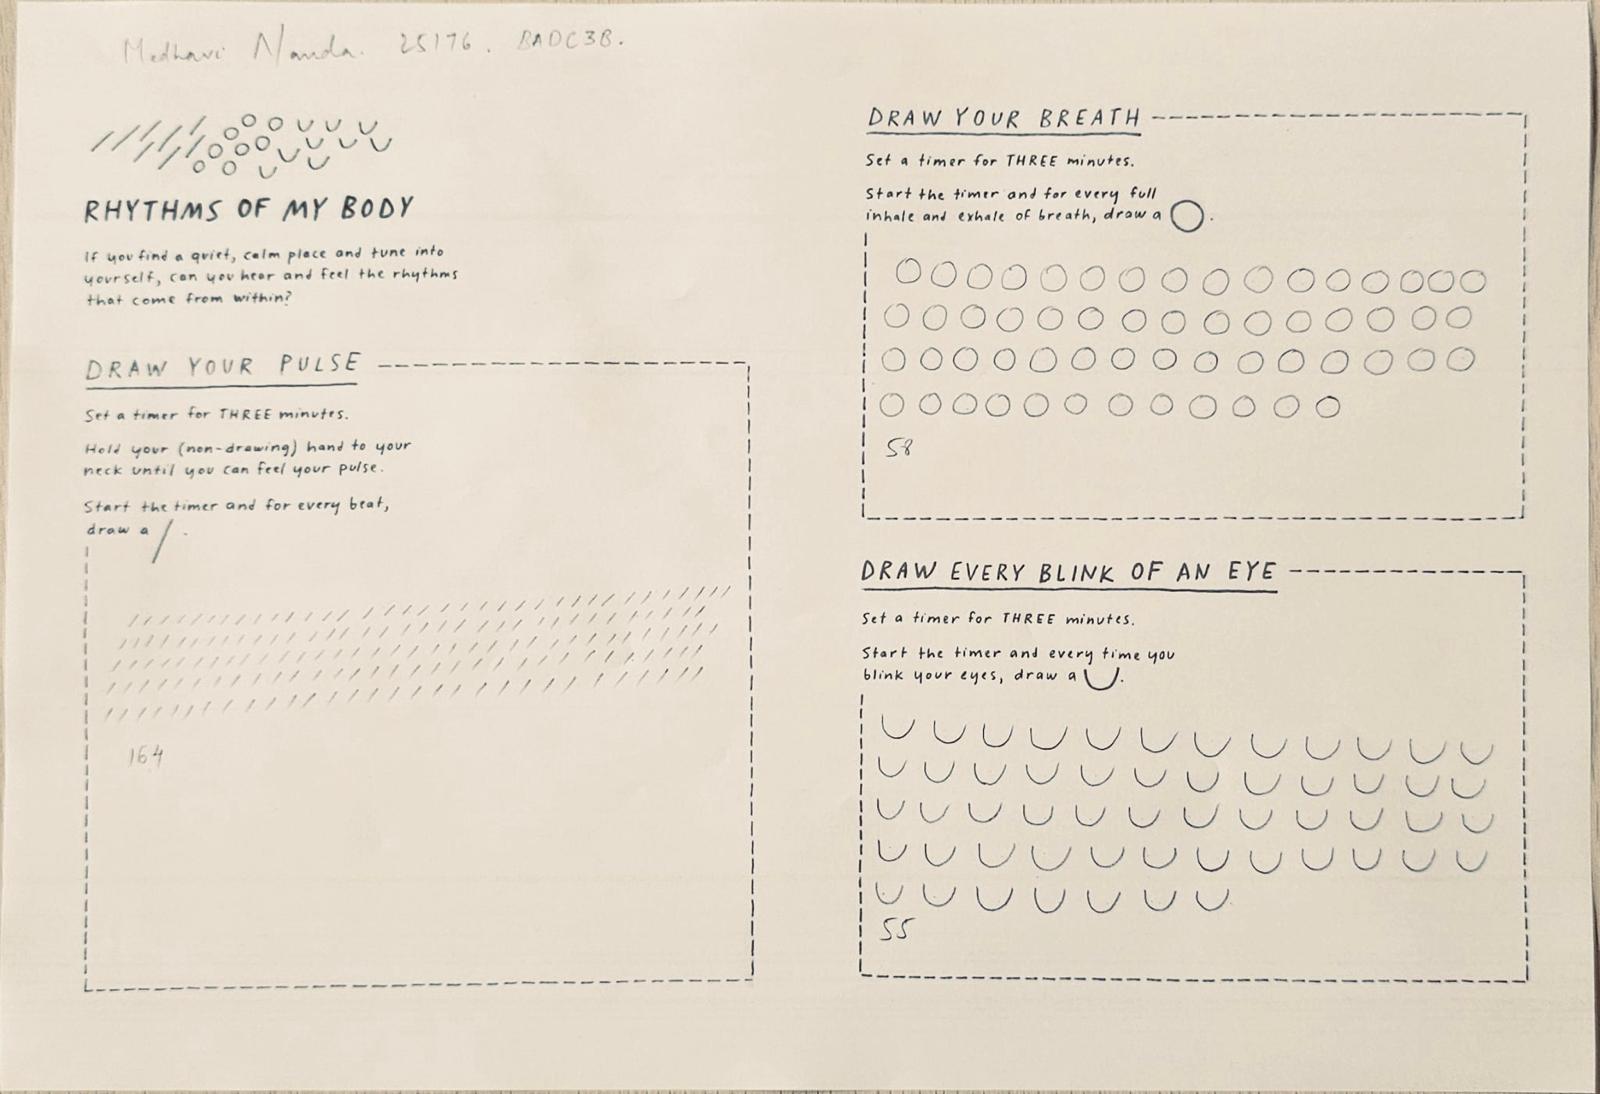
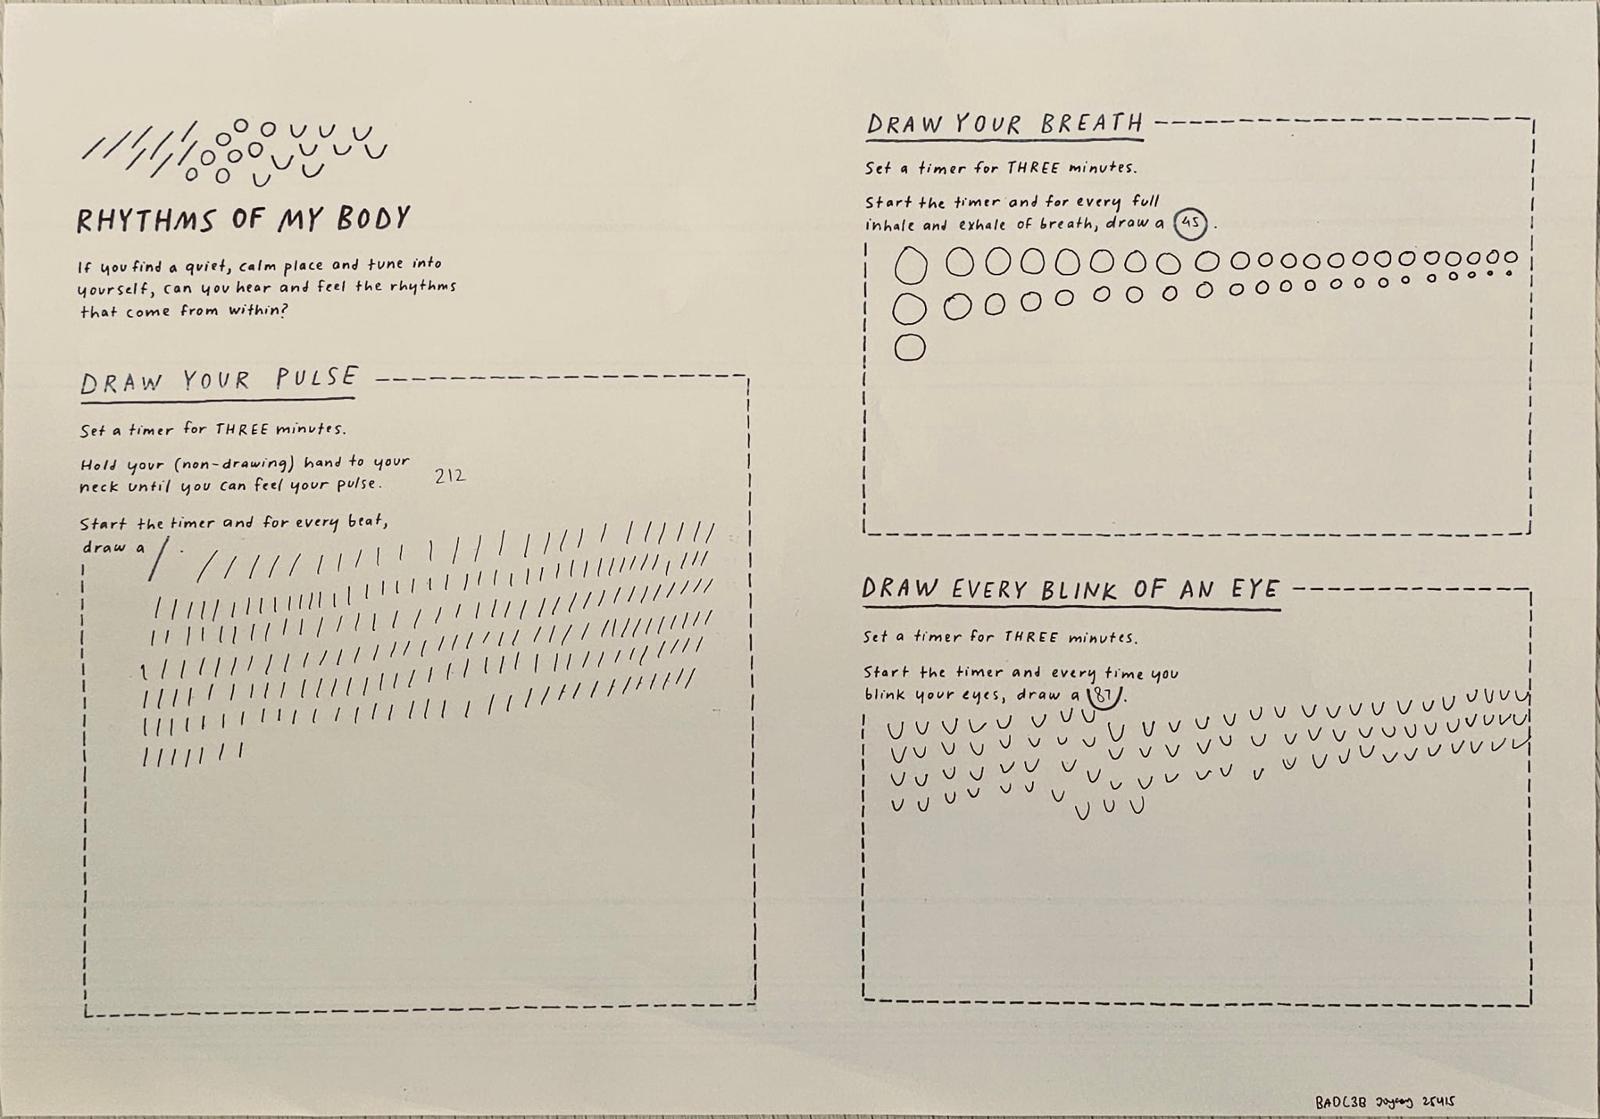
EXPERIMENT 1 : BODY RHYTHMS
For this experiment, we collaborated to use p5.js to visualize the recorded data on breath, pulse, and
blinks from each member of our group, with each person contributing their own measurements: Joycey for pulse, Geraldine for breath, and Medhavi for blinks.
This diverse range of physiological data allowed us to explore the connections between our bodies in a
dynamic and engaging way.
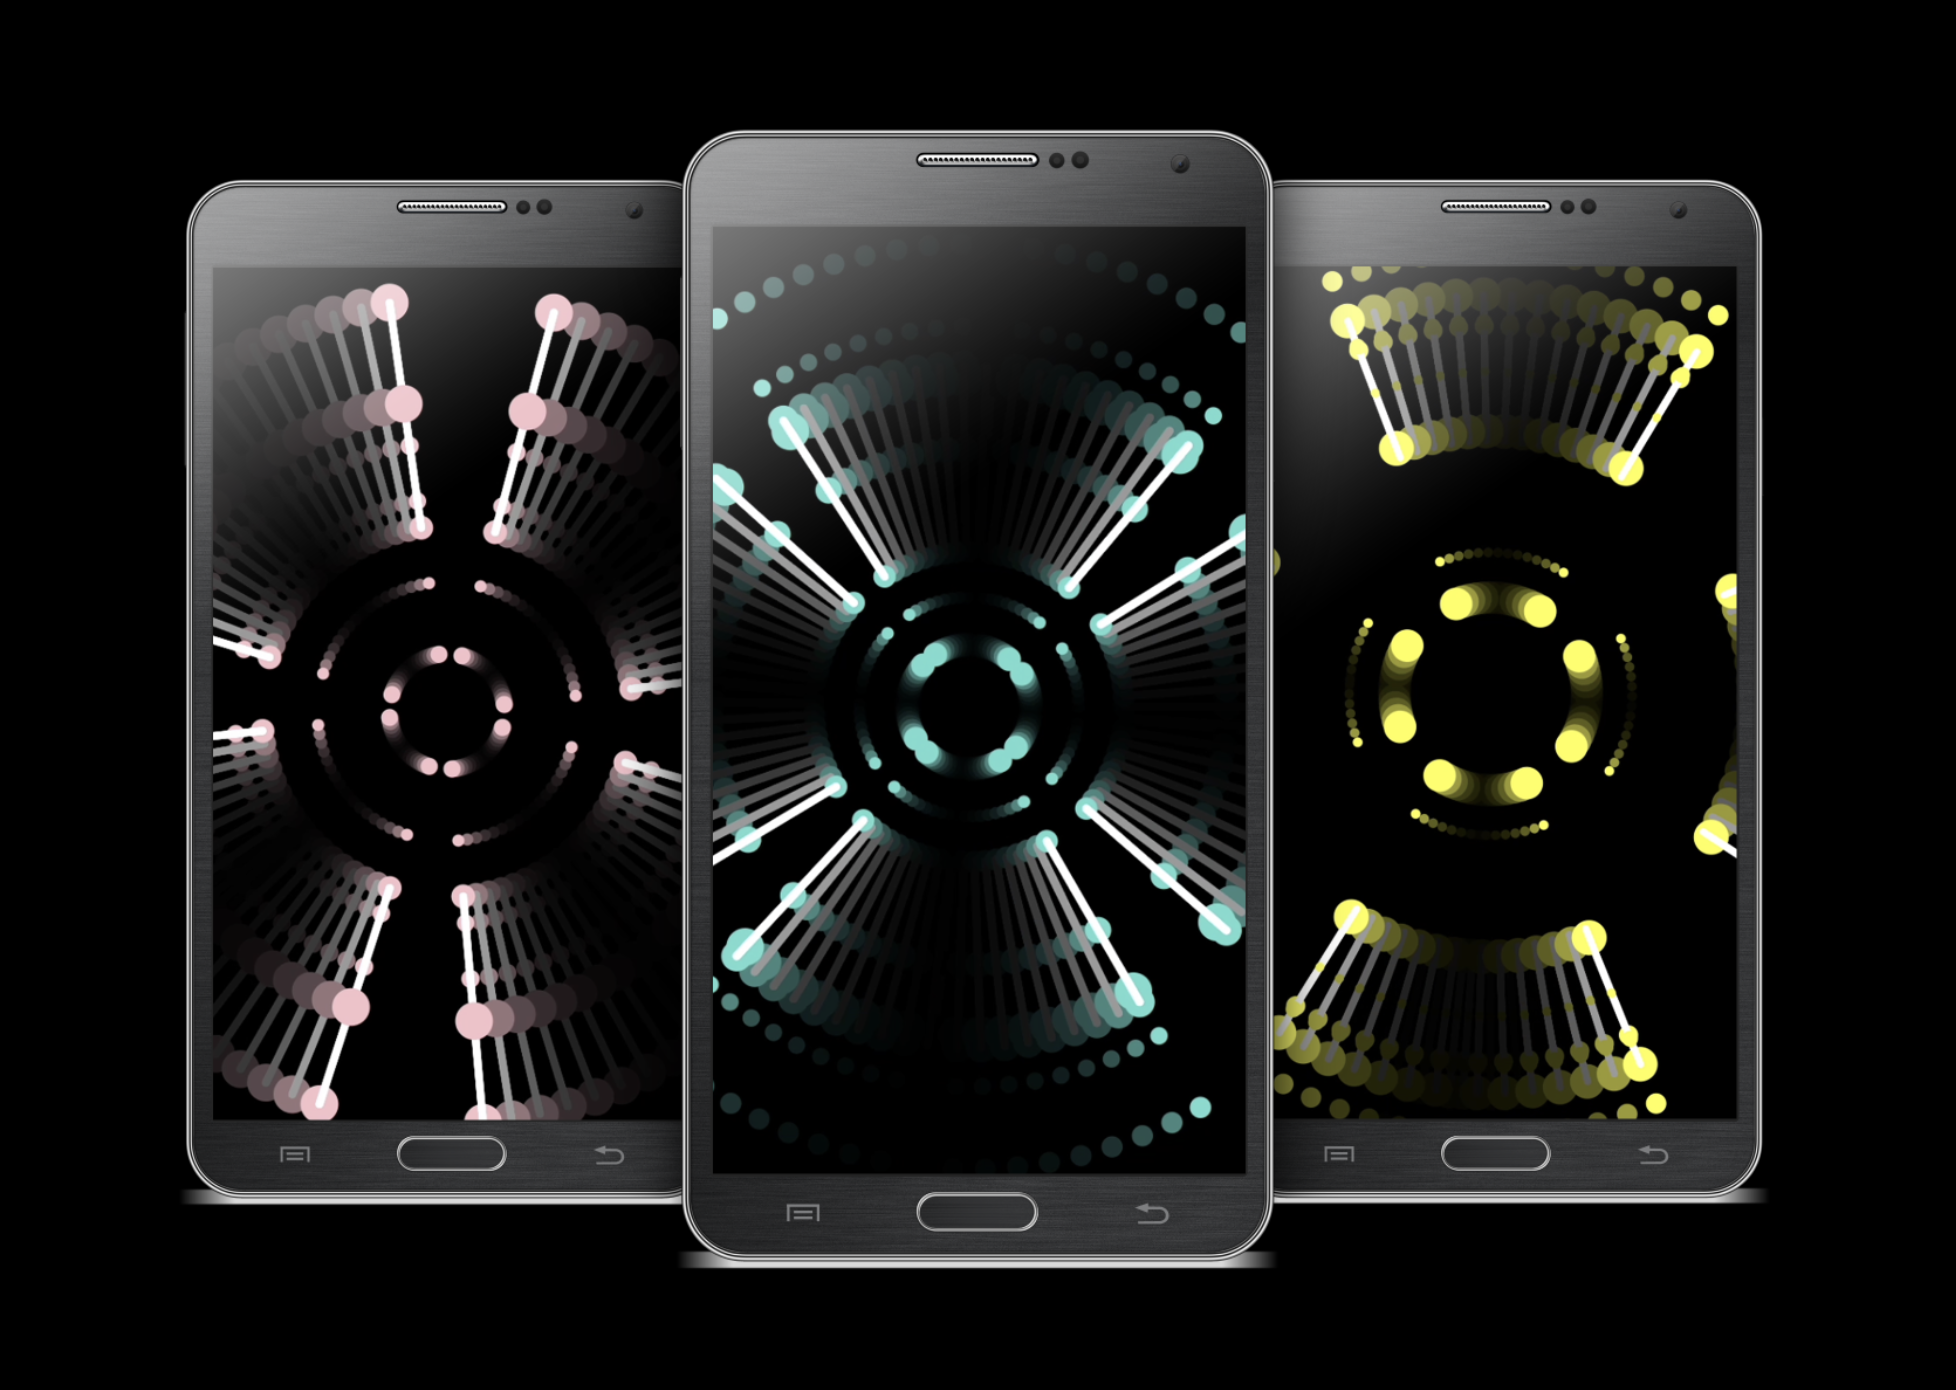
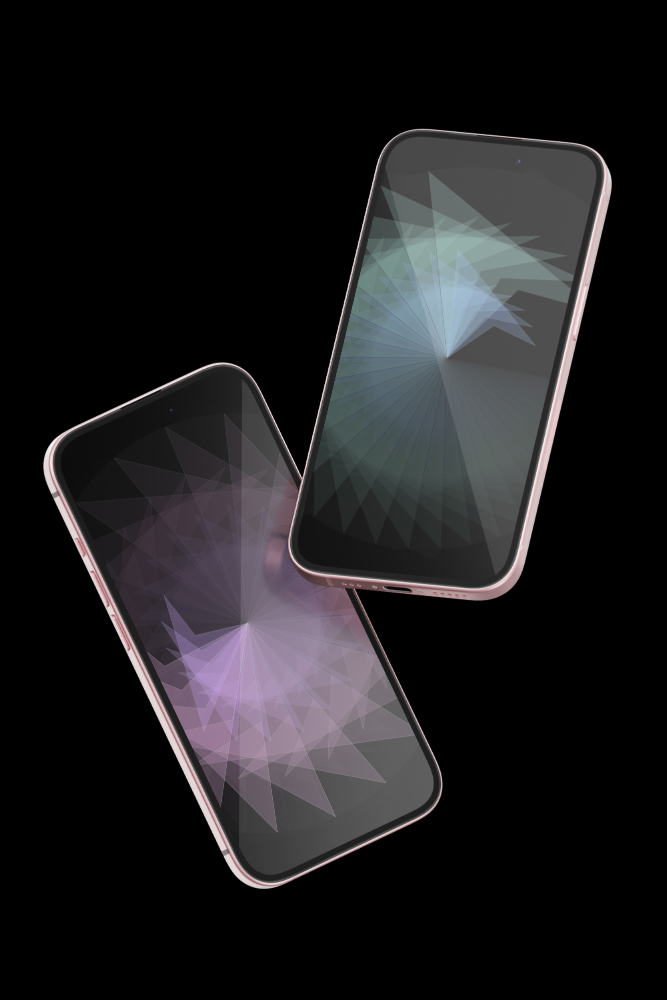
Each member’s data was assigned a unique color : yellow for Joycey’s data, pink for Geraldine and blue for Medhavi. To bring our data to life, we chose to represent it through captivating radial patterns that shift and
evolve based on the variability in our recorded values. The radial design not only offered a visually
striking representation but also symbolized the cyclical nature of our bodily rhythms. As we developed
the visualization, we carefully designed it to reflect not only individual contributions but also the
collective experience of our group.
The color coding created a vibrant and abstract representation of the
rhythm of our bodies, making it easy to differentiate between our data at a glance. The radial
patterns radiated outward from a central point, creating a sense of unity while illustrating the
distinct rhythms of each member.
This interplay of colors and radial patterns not only showcased our individual rhythms but also highlighted the interconnectedness of our physiological states. It was fascinating to see how our distinct data points merged into a cohesive visual narrative, illustrating the collective experience of our group. The project became more than just a data visualization; it transformed into an exploration of our shared human connection and the ways our bodies respond to different stimuli.
"Our biological rhythms are the symphony of the cosmos, music embedded deep within us to which we dance, even when we can't name the tune. In nature nothing is at standstill, everything pulsates, appears and disappears. Heart, breath, digestion, sleep and waking - birth and death - everything comes and goes in waves. Rhythm, periodicity, harmonious alternation of extremes is the rule. This is the very pattern of life."


In Experiment 1, we set out on a creative adventure, using p5.js to transform the rhythms of our bodies into vibrant visual expressions. As we played with our physiological data, we discovered how each shape and color could tell a story - our individual experiences woven together into a beautiful tapestry. As we reflect on this experience, we’re reminded that our physical sensations are not just numbers; they are integral parts of our identities. By visualizing these rhythms, we hope to encourage others to explore their own sensations and appreciate the intricate dance of life that exists within each of us.